

Data reviewed: 12 August 2026. PVC production and disposal statistics are often combined from sources with different years, regions and definitions. This guide separates global all-plastics data from PVC-specific European programme data and explains what each number can—and cannot—show.
Verified figures and their scope
| Metric | Reference year | Reported value | Scope and limitation |
|---|---|---|---|
| Global plastics production | 2019 | 460 million tonnes | All plastics; OECD estimate, not PVC production alone |
| Global plastic waste | 2019 | 353 million tonnes | All plastics; OECD estimate |
| Ultimately recycled plastic waste | 2019 | 9% | All plastics after recycling losses; not a PVC recycling rate |
| Incinerated plastic waste | 2019 | 19% | All plastics; global OECD model |
| Landfilled plastic waste | 2019 | Almost 50% | All plastics; sanitary-landfill category in OECD reporting |
| Mismanaged plastic waste | 2019 | 22% | All plastics; uncontrolled dumping, open burning or leakage |
| PVC waste recycled within VinylPlus | 2025 | 765,972 tonnes | European VinylPlus framework; not global PVC recycling |
Sources: the OECD Global Plastics Outlook and VinylPlus Progress Report 2026 highlights. Values are reproduced with their original scope rather than blended into a new global PVC rate.
Why there is no single current “global PVC production” number here
Public PVC figures come from resin-production estimates, demand forecasts, polymer consumption, converter use and trade data. They may cover virgin resin only or include compounds and recycled content; regions and calendar years also differ. Commercial market reports often publish estimates without a fully accessible method.
A defensible global PVC production value should identify the reporting organisation, year, geography, unit, product boundary and whether the method is available. Without those fields, a precise-looking value can mislead comparisons.
What the OECD numbers mean
The OECD estimated that annual global plastics production rose from 234 million tonnes in 2000 to 460 million tonnes in 2019, while plastic waste increased from 156 million tonnes to 353 million tonnes. After accounting for recycling losses, it reported that 9% of plastic waste was ultimately recycled.
These figures provide global context for plastics as a whole. They must not be presented as PVC-specific production, disposal or recycling rates. PVC has different product lifetimes and applications from short-lived packaging polymers; construction products can remain in use for decades, so annual resin production and annual PVC waste generation are not interchangeable.
What the latest VinylPlus figure means
VinylPlus reports that 765,972 tonnes of PVC waste were recycled within its framework in 2025. Its public summary states that 58.8% was pre-consumer waste and 41.2% was post-consumer waste. The report is a current, auditable measure of the programme’s European activity.
It is not the total amount of PVC recycled worldwide, the total PVC waste generated in Europe or a global recycling rate. Programme boundaries, participating countries, data verification and counted streams should remain attached whenever the number is quoted.
PVC applications make waste timing difficult to compare
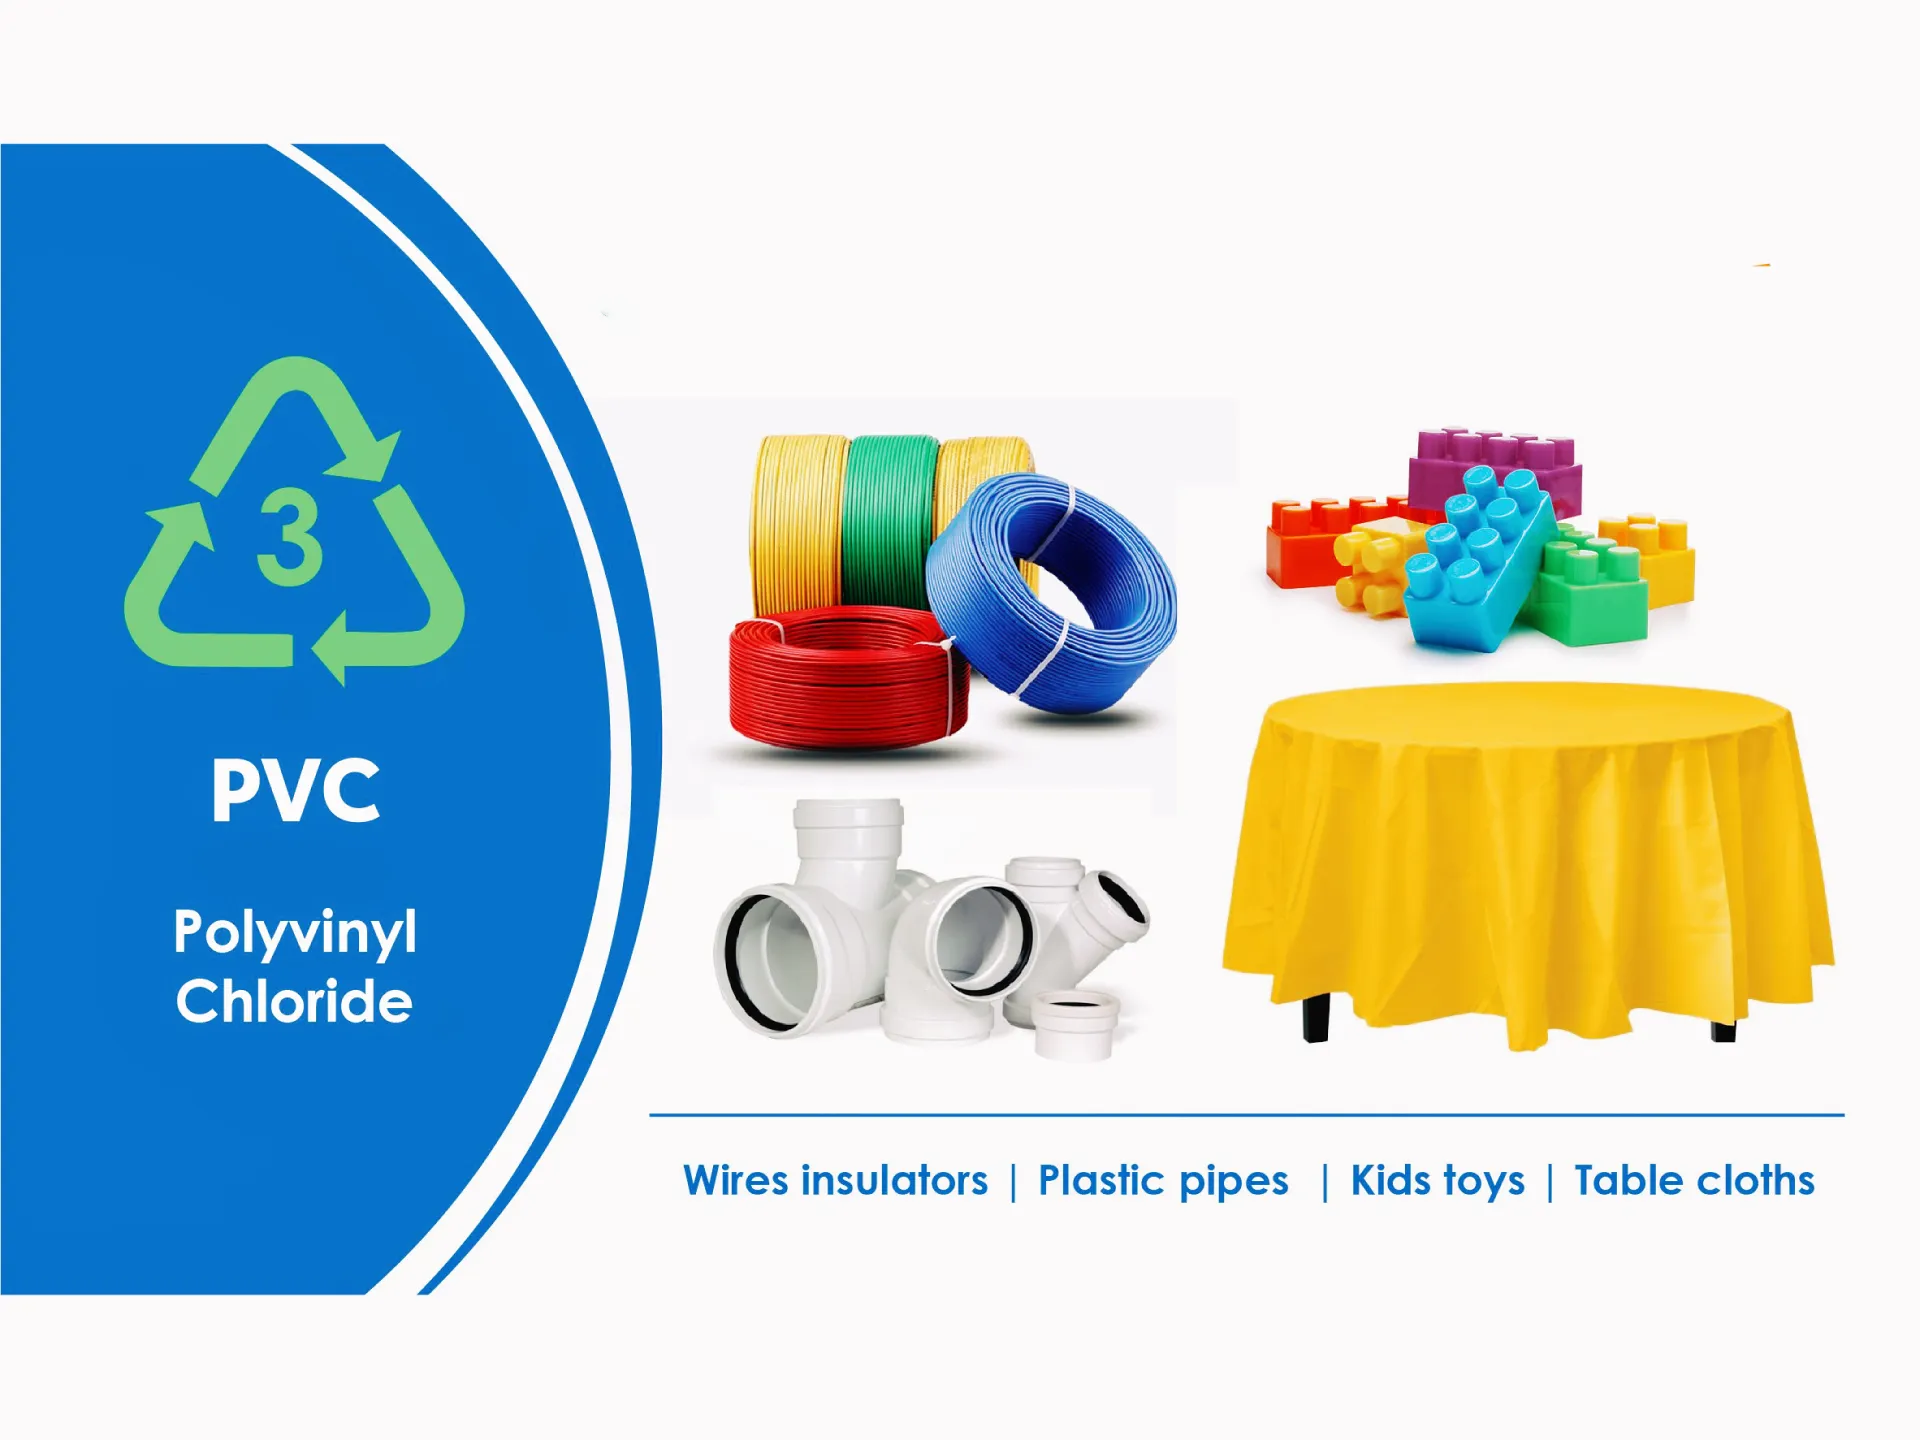
PVC is used in long-life building products such as profiles, pipes, flooring and cables, as well as shorter-life packaging and consumer products. Additives, fillers, plasticisers, stabilisers, colours and composite construction vary across these applications.
A production total for one year does not become waste in the same year. A useful material-flow study needs product lifetimes, imports and exports, stock in use, demolition activity and collection. This is why a production number should not be combined directly with a current recycling tonnage to calculate a PVC recycling percentage.
Disposal terms must be defined
“Disposal” can mean landfill only, or it can be used loosely for all non-recycled material. OECD separates recycling, incineration, sanitary landfill and mismanaged waste for its 2019 all-plastics model. National statistics may use different categories, especially where energy recovery is reported separately.
When comparing PVC data, check whether incineration includes energy recovery, whether exported waste is assigned to the exporting or receiving country, and whether recycling is measured at collection, sorting input or accepted recyclate output.
Why PVC matters in PET bottle recycling
PVC is a critical contaminant in PET recycling because both materials commonly report to the sink fraction in a water-based tank. Density separation can remove many floating PE or PP closures from sinking PET, but it cannot reliably split PVC from PET.
PVC can degrade under PET processing conditions and affect colour and material properties. The allowable level depends on the buyer, application and test method rather than one universal threshold. The Association of Plastic Recyclers’ PET rigid design guidance treats PVC components as detrimental to PET reclaiming.
See the separate technical article on PVC contamination in PET bottle recycling for detection and process controls.
How recyclers control PVC-containing streams
- Define the stream: keep PET bottles, PVC profiles, pipes, cable, flooring and mixed rigid waste under separate intake specifications where practical.
- Sort before shredding: remove identifiable non-target products while they are large enough to recognise.
- Use validated detection: optical or other sensor sorting should be tested on actual colour, shape, labels and throughput.
- Apply density separation correctly: use it for compatible float/sink pairs, not as proof that PET and PVC have separated.
- Control additives and legacy products: define restricted substances and applications with the downstream buyer and applicable regulation.
- Test outputs: use a laboratory method and frequency that match the buyer’s specification.
Equipment does not make every PVC stream equivalent
A rigid plastic washing line can be configured for a defined PVC or mixed-rigid feed, but washing removes target surface contamination; it does not erase polymer, additive or product-history differences. A rigid PVC profile stream and flexible PVC cable compound may require different sorting, size reduction, dust control and outlets.
Choose shredder, granulator, washer, separator and dryer only after the material and final specification are documented. Keep a dry mass balance of feed, rejects and accepted product so that recycling claims refer to actual output.
How to cite PVC statistics responsibly
- name the original publisher and link the exact source;
- state the reference year, region and polymer scope;
- distinguish production, consumption, waste generation, collection and accepted recyclate;
- state whether data are measured, reported by participants or modelled;
- do not convert a programme tonnage into a global recycling rate;
- show the date when the data table was last reviewed.
Frequently asked questions
How much PVC is produced globally each year?
Published estimates vary by year and product boundary. This article does not repeat a single value without a current, transparent source that defines resin, compounds, recycled content and geography.
Is the OECD 9% recycling figure a PVC recycling rate?
No. It is the OECD’s estimate for all global plastic waste in 2019 after recycling losses, not a PVC-specific rate.
Can a sink-float tank remove PVC from PET?
Not reliably because both commonly sink in water. PET recyclers need upstream sorting, validated detection and output testing for PVC control.
Use scoped data in project decisions
For a PVC recycling project, provide Energycle with the product stream, region, annual collected mass, additive information and buyer specification. Statistics can establish context, but equipment capacity and output claims must come from representative material trials.
